When we built the ClickUp Super Agent team health system you’ll have seen in the original case study, we ran into a deceptively simple question: Out of everything we could track, what actually deserves to be a team health signal every week?
Dashboards were already in place. Leaders could see delivery dates, workloads, and progress. HR had visibility into where work was bunching up. The data layer was solid. The challenge wasn’t “How do we get more data?” It was: “What are the few patterns that should reliably nudge HR and leaders to pay attention?”
Using ClickUp Brain and Super Agents, we can now layer an AI-driven interpretation on top of existing dashboards. This article walks through how we answered that question and chose the signals that now power the Super Agent described in the original ClickUp Super Agent team health system article.
Step 1: Start from the questions people actually ask
We sat down with HR and engineering leadership and collected the questions that kept coming up in 1:1s, stand-ups, and retrospectives. Variations of these showed up again and again:
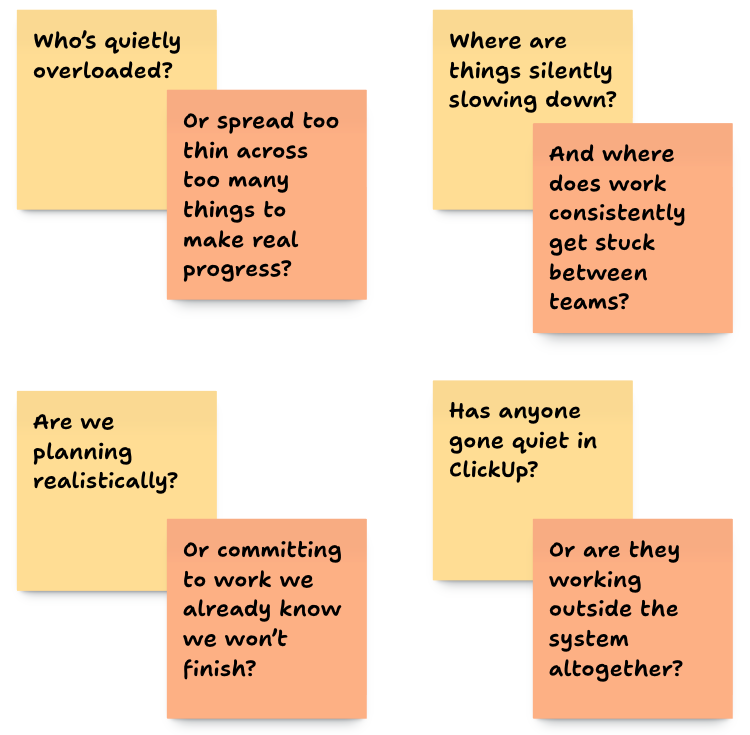
And one question that sat underneath all of them:
What’s going to become a problem in a few weeks… if nothing changes?
Those questions became our starting brief. Then we asked, where does ClickUp already know the answer? That allowed us to anchor our signals that already existed in the system, just not yet surfaced in a way that prompted action.
Step 2: Map real questions to existing dashboards
By the time we introduced a Super Agent, dashboards were already doing their job:
- Workload views by person and squad
- Delivery and due‑date views by project
- Sprint boards and scope breakdowns
- Activity views showing comments and updates
We treated those dashboards as the data layer, and the Super Agent as a thin story layer on top. For each recurring question, we mapped it back to specific dashboards and underlying data points. For example:
- “Who’s quietly overloaded?” → active tasks per person in the Dev folder, compared to the team median.
- “Where are things silently slowing down?” → cycle time by project and list.
- “Are we planning realistically?” → whether work is entering faster than it’s completed
- “Has anyone gone quiet?” → comments, status changes, and other updates per person.
If we couldn’t connect a question back to a dashboard or a clear set of ClickUp fields, it didn’t make the cut for a first‑round signal.
Step 3: Group potential signals into four buckets
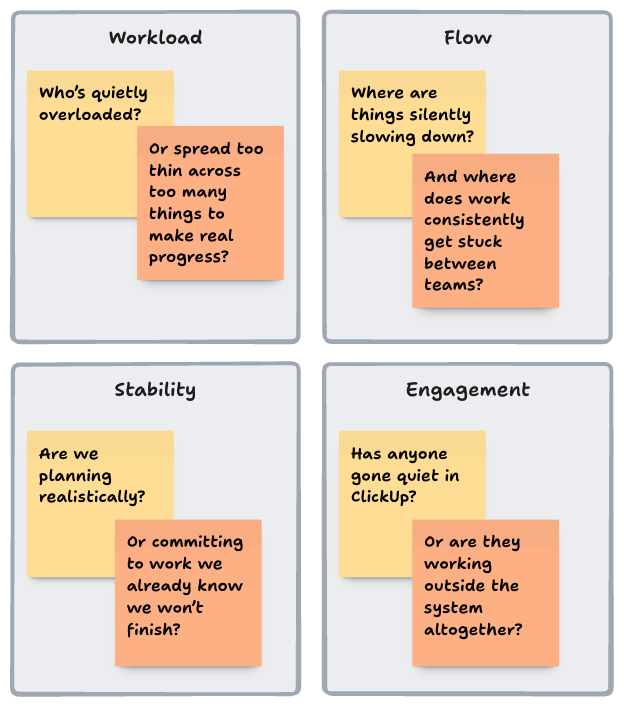
With questions and data sources in hand, we grouped everything into four team health buckets:
- Workload – are people carrying a sustainable amount of work, or quietly taking on too much?
- Flow – is work moving smoothly from start to finish, or getting stuck, bouncing, or slowing down?
- Stability – are priorities and expectations staying consistent enough for teams to deliver, or constantly shifting?
- Engagement & interaction – is work visible and happening inside ClickUp, or are signals starting to disappear?
That gave us a simple rule of thumb:
Every signal needed to sit clearly in one of these buckets and answer one of our original questions.
We then drafted 1–2 candidate signals per bucket, always anchored in dashboards that already existed. A few concrete examples:
Workload: spotting quiet overload
Question: Who’s carrying more than is sustainable? Who’s spread too thin?
Data we used:
- Active tasks per person in the Dev folder
- The team median for active tasks
- How those patterns changed over the last 2–3 weeks
Signal we designed for our ClickUp Super Agent:
Flag anyone who has carried significantly more active tasks than the team median for three weeks in a row.
In dashboards, this was visible but easy to gloss over. As a signal, it became a clear prompt:
“It may be time to revisit this person’s priorities and support.”Flow: seeing where work gets stuck
Question: Where are things silently slowing down? Where are handovers breaking?
Data we used:
- Status change history for tasks in the Dev folder
- Average time spent in In Progress vs baseline
- Tasks bouncing In Progress → Blocked → In Progress multiple times
Signal we designed for our Super Agent:
Call out projects where cycle time has jumped, especially when tasks keep bouncing between In Progress and Blocked.
Dashboards already showed “cycle time by project” and “blocked tasks”. The signal turned that into a weekly narrative like:
“Over the last two weeks, cycle time for Project X has nearly doubled, mainly due to tasks bouncing between In Progress and Blocked. Look at handover points between teams on this project.”
Stability: protecting sprints from moving ground
Question: Are we giving squads a stable enough scope to deliver? Are we changing direction mid-flight?
Data we used:
- Sprint lists and their start dates
- Tasks added after sprint kick‑off
- How often that happened across multiple sprints
Signal we designed:
Highlight any squad where new work is added mid‑sprint for three sprints in a row.
Again, the dashboards already knew what was in scope. The Super Agent simply surfaced the pattern:
“We’re quietly turning every sprint into a wish‑list.”Engagement & interaction: noticing when things go quiet
Question: Has anyone effectively disappeared from ClickUp? Are people working outside the system?
Data we used:
- Comments, status changes, and task updates per person
- Each person’s own historical baseline
Signal we designed:
Call out individuals or squads whose ClickUp activity has dropped sharply while open work has stayed the same or increased.
This mattered because a drop in interaction doesn’t always mean someone isn’t working – but it can be an early sign of being blocked, overwhelmed, working outside the system, or disengaging. The weekly signal nudged HR and managers to ask the right check‑in questions.
Step 4: Set opinionated thresholds for our ClickUp Super Agent
At this point, we had a long list of candidate signals. The risk was obvious: turn the agent on as‑is, and it would become AI noise. So we took an opinionated approach to thresholds, and treated the first weeks as a pilot.
1. Start from “normal”
We looked back over a few weeks of dashboard data and defined what normal looked like for:
- Overdue tasks
- Cycle times
- Active tasks per person
- Scope changes per sprint
2. Define “meaningful change”
Then we set thresholds that felt like they should trigger a conversation, not a shrug. For example:
- Overdue work doubling vs the previous 2–3 weeks
- A person carrying 50–100% more active tasks than the team median
- Scope being added mid‑sprint for three sprints in a row
3. Pilot quietly in a small channel
We pointed the Super Agent at a private ClickUp chat for HR and one or two leaders and let it run weekly updates for a few weeks.
After each summary, we asked two questions:
- “Did this signal lead to a conversation or decision?”
- “Did anything feel like over‑reporting or ‘AI spam’?”
4. Tighten, drop, and re‑word
Based on those reactions, we:
- Raised thresholds where the agent felt too chatty.
- Removed signals that never changed behaviour.
- Smoothed the language so updates read like a human‑written summary, not a data dump.
By the end of the pilot, we’d moved from a big wish‑list to a short set of signals everyone trusted.
Step 5: Turn every signal into a clear “so what?”
One more thing we learned quickly: a raw metric rarely changes anything. Every signal we kept had to end with an implicit or explicit next step. For example:
- “Review sprint planning scope with the product owner before the next sprint.”
- “Check in with this person’s manager about workload and priorities.”
- “Look at how work is handed over between teams on these projects.”
The dashboards provide the detail. The Super Agent provides the prompt and starting point for the conversation. A good test we used while tuning was:
“If this shows up in the weekly summary, what conversation should it start?”
If we couldn’t answer that clearly, we either adjusted the signal or dropped it.
Step 6: From our signals to your own
The goal of sharing this process isn’t for you to copy our signals line‑by‑line. Instead, you can reuse the same approach:
- Collect the real questions HR and leadership keep asking.
(Overload, silent slow‑downs, planning realism, engagement.) - Map those questions to data your ClickUp dashboards already show.(Status histories, cycle times, work in progress, comments, sprint changes.)
- Draft 5–10 candidate signals across workload, flow, stability, and engagement. Make sure each one points to a specific next step.
- Run a 4–6 week pilot in a small channel, then cut ruthlessly until only the most useful signals remain.
Your dashboards stay as they are: the structured, detailed view of what’s happening. Your Super Agent becomes the lightweight layer on top that reads those dashboards for you and says:
“Here are the three things to pay attention to this week, and why they matter.”That’s the system we ended up with – and the one you see in the original Super Agent team health article. This piece is the behind‑the‑scenes: how we decided which signals made it in, and which ones we left on the cutting‑room floor.
Ready to turn your dashboards into real team health signals?
If you’re already using ClickUp dashboards and want a clearer read on how your teams are really doing, a focused workflow assessment is the fastest way to start. In a ClickUp workflow assessment, we’ll:
- Map the questions HR and leadership actually ask to the data you already have in ClickUp
- Review your current spaces, dashboards, and key workflows
- Sketch a first set of team health signals (and a simple 4–6 week pilot) tailored to your squads
Use the button below to book a session and see what a Super Agent-style team health system could look like for your organisation.
Free. No commitment. No sales pitch.
FAQs
What is a ClickUp Super Agent?
A ClickUp Super Agent is an AI layer that reads your ClickUp data and surfaces patterns such as workload imbalance, delivery risks, and team engagement signals.
How do you measure team health in ClickUp?
Team health can be measured using workload distribution, cycle time, task flow, sprint stability, and activity levels within ClickUp.
Do ClickUp dashboards show team health automatically?
No. Dashboards show raw data. A structured system or AI layer is needed to translate that data into meaningful team health signals.
Can ClickUp be used for HR and team performance insights?
Yes. With the right structure, ClickUp can provide visibility into workload, engagement, and delivery performance across teams.